Integrate JMeter in Grafana Dashboard by using InfluxDB as a backend
What is Grafana?
Grafana is an open source metric analytics & visualization suite. It is most commonly used for visualizing time series data for infrastructure and application analytics but many use it in other domains including industrial sensors, home automation, weather, and process control.
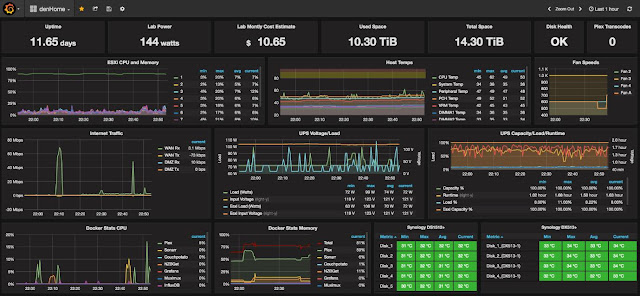
Sample dashboard:
- Download Grafana from the link(https://grafana.com/grafana/download)
- unzip grafana-4.5.2.windows-x64.zip in your machine and execute the server file in the location grafana-4.5.2.windows-x64\grafana-4.5.2\bin\grafana-server.exe
- Once executed verify the Grafana by http://localhost:3000 in the browser.
- Grafana default username is admin and password is an admin.
- We need influxDB to store the JMeter test result.
What is InfluxDB?
InfluxDB is an open-source* (1.1.0) time series database developed by InfluxData. It is written in Go and optimized for fast, high-availability storage and retrieval of time series data in fields such as operations monitoring, application metrics, Internet of Things sensor data, and real-time analytics.
Download InfluxDB https://dl.influxdata.com/influxdb/releases/influxdb-1.1.0_windows_amd64.zip and unzip the same.
- Open the Config file in the location \influxdb-1.1.0_windows_amd64\influxdb-1.1.0-1 and uncomment the following and save Graphite set up on the same.
- Execute the file influxd.exe in the location(\influxdb-1.1.0_windows_amd64\influxdb-1.1.0-1\) to start the InfluxDB
- Execute the file influx.exe in the location(\influxdb-1.1.0_windows_amd64\influxdb-1.1.0-1\) to start the create a database.
- Query to create a Database "Create Database JMeter(Db name which we are going to use in JMeter script)"
- Show Databases "To see the available database"
- UseJMeterr(Database)
- Show the Measurement "Will display the available measurements in the Database if available"
Please refer the following link for more commands https://docs.influxdata.com/influxdb/v1.3/query_language/spec/
Jmeter + InfluxDB
- Download influx DB writer for JMeter from the link https://github.com/NovaTecConsulting/JMeter-InfluxDB-Writer/releases and place the same in the location Jmeter\apache-JMeter-3.3\lib\ext\JMeter-InfluxDB-Writer-plugin-1.2.jar
- Now Restart the Jmeter
- Open the respective project in your JMeter UI
- Add the Backend Listener to your project (Right click Thread Group -> Add-> Listener->Backend Listener)
- Select rocks.nt.apm.jmeterJMeterInfluxDBBackendListenerClient from the Backend Listener Implementation and set up the configuration as how in the below image.
- Run the Jmeter at least for 1 time to see the table detail in the InfluxDB
- Use the comment show measurement for the table jmeter for the db data
- After Jmeter Execution
- Like that, we can see the information details using the script
Grafana + Influx Db configuration
Launch the localhost:3000 and add the data source.
Fill the following details
- Name for the data source
- Type: Influxdb
- URL: http://localhost:8086
- Access: Direct
- Database JMeter (As of now we are not using an authorization for the DB).
- Click Add to save the Datasource
After data source configuration.
- Go to Menu-> Dashboard-> New
- Select the graph you are looking for
- Click on the graph title to edit
- Select the Data Source in Metrix-> Datasource->Jmeter (Data source name)
- Select the Request type you like to configure in your database.
Below image show graph for the respective query
Jmeter grafana dashboard after configuring all the details.
Note: You can build your own dashboard with the available options in grafana.


Comments
Post a Comment