Integrate JMeter in Grafana Dashboard by using InfluxDB as a backend
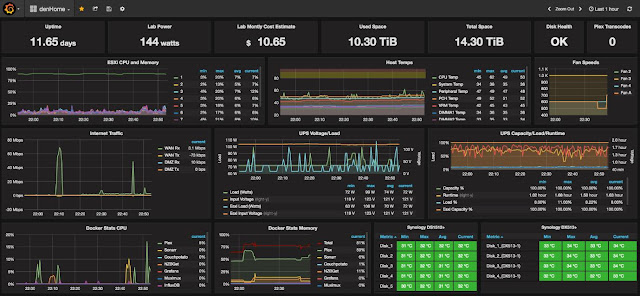
What is Grafana ? Grafana is an open source metric analytics & visualization suite. It is most commonly used for visualizing time series data for infrastructure and application analytics but many use it in other domains including industrial sensors, home automation, weather, and process control. Sample dashboard: Download Grafana from the link(https://grafana.com/grafana/download) unzip grafana-4.5.2.windows-x64.zip in your machine and execute the server file in the location grafana-4.5.2.windows-x64\grafana-4.5.2\bin\grafana-server.exe Once executed verify the Grafana by http://localhost:3000 in the browser. Grafana default username is admin and password is an admin. We need influxDB to store the JMeter test result. What is InfluxDB ? InfluxDB is an open-source* (1.1.0) time series database developed by InfluxData. It is written in Go and optimized for fast, high-availability storage and retrieval of time series d...